Active Galactic Nuclei
How did supermassive black holes grow so large so early?
Why it matters
Black hole masses at high redshift are mostly inferred indirectly, through scaling relations calibrated on nearby objects. Measuring one directly means watching the broad emission lines respond to a change in the continuum, and timing the delay — reverberation mapping, which has always required repeated spectroscopy on a single object at a time.
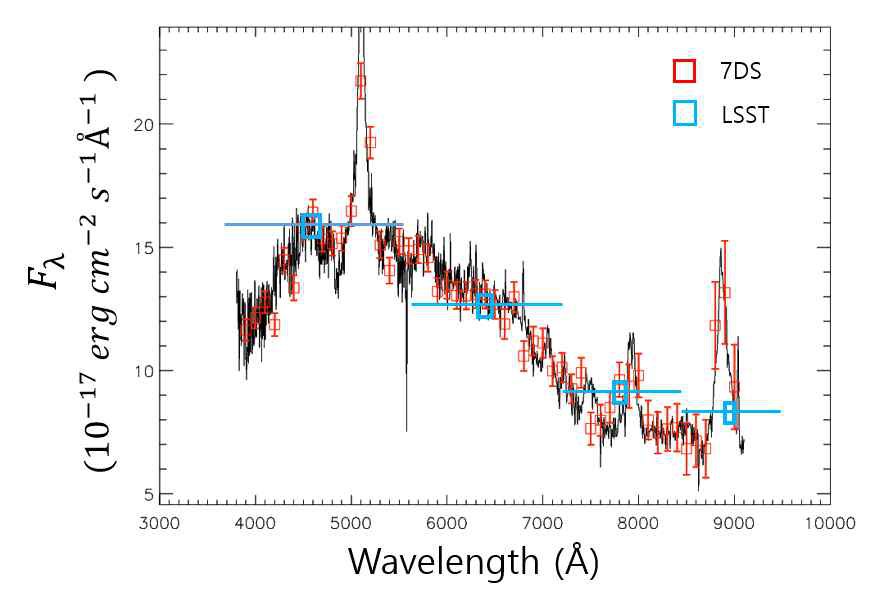
Medium bands turn that into a survey measurement. A filter set that separates the emission lines from the continuum tracks both light curves at once, for every AGN in the field, at whatever cadence the survey runs. The delay also scales with luminosity, which makes it a candidate distance indicator and ties this theme back to cosmology.
The same data are sensitive to AGN that change type between epochs, to stars disrupted by the black holes they fall into, and to the periodic variability expected of binary black holes.
What 7DS contributes
Repeated medium-band visits measure how an AGN spectrum changes, not only how its brightness does. The 10–14 day cadence of WTS over five years is suited to reverberation mapping through long-term spectral variability, while the nightly cadence of IMS reaches variability on timescales of a single night.
What it looks like
What the program aims to deliver
- Time-series spectra for more than 50,000 active galactic nuclei
- Direct mass measurements for more than 5,000 supermassive black holes
- More than 20,000 quasars found at low Galactic latitude, where broadband surveys struggle
These are program targets over the seven years of the survey, not results in hand. What has been observed so far is on the status page, and published work is listed under publications.