Performance
What the array delivers on sky, as measured in routine operation rather than specified on paper.
Optical performance
Across the sixteen operational units the point-spread function measured at field center on good nights ranges from 1.4 to 2.2 arcseconds FWHM, with an array median of 2.0 arcseconds closely tracking the median site seeing. Unit-to-unit scatter in delivered FWHM is 0.2 arcseconds, and the PSF grows by 0.3 arcseconds from field center to corner while ellipticity stays below 0.1 over the central 80 percent of the field. Delivered image quality is therefore consistent across the array. Median delivered FWHM has held stable to within 0.3 arcseconds since routine survey operations began in July 2024.
Calibration accuracy
Photometric calibration runs against synthetic photometry derived from Gaia DR3 BP/RP spectra, homogenized to correct the color- and magnitude-dependent residuals reported by the Gaia collaboration. The procedure was established during commissioning on 68 spectrophotometric standard stars, including CALSPEC sources, with non-variable point sources selected following criteria adapted from SkyMapper DR4. Zero-point uncertainty across the twenty medium bands in operational use is 15 to 25 mmag, with the larger values redward of 775 nm where detector quantum efficiency falls and signal-to-noise drops accordingly.
Zero-point uncertainties are larger redward of 775 nm, where detector quantum efficiency falls and signal-to-noise drops with it. The fifteen filters installed in late 2025 are not yet spectrophotometrically calibrated; the original twenty medium bands are the calibrated set in operational use.
Limiting magnitudes
For the canonical 100-second exposure the 5-sigma point-source depth reaches 19.06 mag in the bluest medium band (m400) and 16.60 mag at the longest wavelength (m875), peaking at 19.61 mag in m475 near maximum system throughput. The Sloan broad bands reach 20.59, 20.25 and 19.17 mag in g, r and i. These are nominal-condition figures: seeing better than 2.0 arcseconds, airmass below 1.5, and non-bright nights.
| m400 (bluest medium band) | 19.06 mag |
|---|---|
| m475 (peak throughput) | 19.61 mag |
| m875 (reddest medium band) | 16.60 mag |
| Sloan g | 20.59 mag |
| Sloan r | 20.25 mag |
| Sloan i | 19.17 mag |
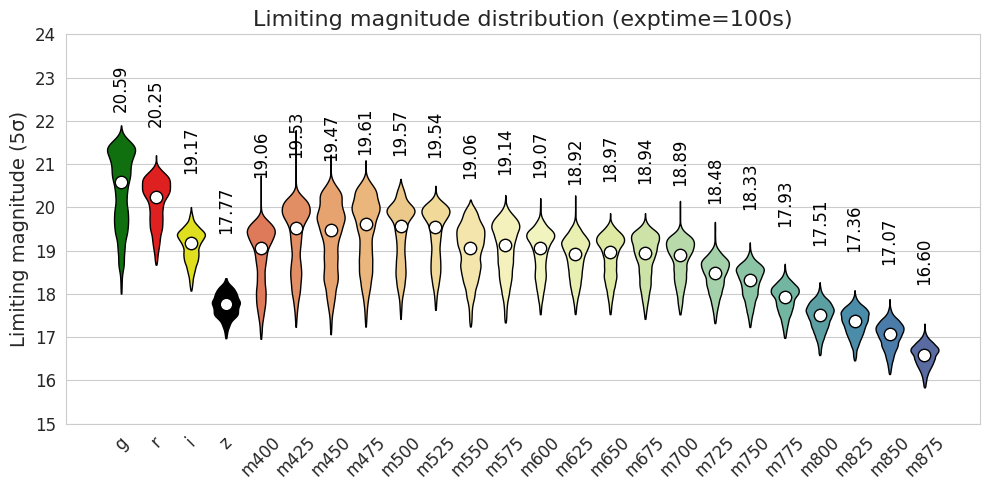
Single-exposure depths above are for a 100 s exposure under nominal conditions: seeing better than 2.0 arcseconds, airmass below 1.5, and a non-bright night. The RIS figure is one visit of 3 × 100 s. WTS and IMS figures are cumulative over the planned five-year operation, not the depth of any single visit.
Planning an exposure
To estimate the signal-to-noise expected for a source, combine the depths above with the filter response curves. The supy package includes a simulator module that generates filter and detector response for the 7DT bands, and an observer module for target visibility from El Sauce. Both are described under available software.